|
Download Data (XLS File) |
|
|||||
|
|||||
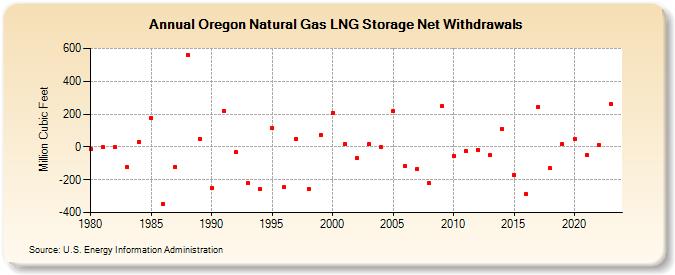
| Oregon Natural Gas LNG Storage Net Withdrawals (Million Cubic Feet) | |||||
| Decade | Year-0 | Year-1 | Year-2 | Year-3 | Year-4 | Year-5 | Year-6 | Year-7 | Year-8 | Year-9 |
|---|---|---|---|---|---|---|---|---|---|---|
| 1980's | -13 | -3 | -1 | -124 | 32 | 178 | -346 | -122 | 560 | 49 |
| 1990's | -249 | 220 | -33 | -222 | -257 | 114 | -246 | 48 | -256 | 73 |
| 2000's | 208 | 19 | -70 | 15 | -3 | 217 | -119 | -136 | -222 | 247 |
| 2010's | -53 | -25 | -16 | -50 | 111 | -172 | -288 | 245 | -131 | 17 |
| 2020's | 48 | -49 | 13 | 263 | -19 |
| - = No Data Reported; -- = Not Applicable; NA = Not Available; W = Withheld to avoid disclosure of individual company data. |
| Release Date: 6/30/2026 |
| Next Release Date: 7/31/2026 |