|
Download Data (XLS File) |
|
|||||
|
|||||
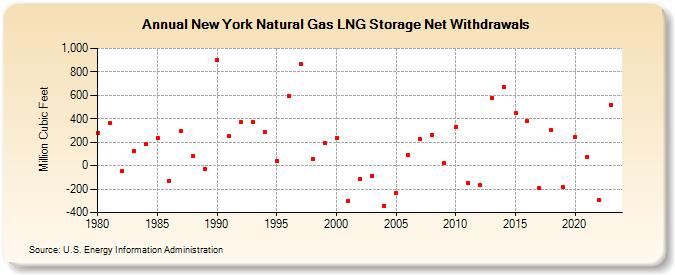
| New York Natural Gas LNG Storage Net Withdrawals (Million Cubic Feet) | |||||
| Decade | Year-0 | Year-1 | Year-2 | Year-3 | Year-4 | Year-5 | Year-6 | Year-7 | Year-8 | Year-9 |
|---|---|---|---|---|---|---|---|---|---|---|
| 1980's | 282 | 362 | -46 | 124 | 181 | 239 | -130 | 296 | 80 | -31 |
| 1990's | 902 | 250 | 370 | 371 | 290 | 40 | 591 | 865 | 58 | 197 |
| 2000's | 238 | -298 | -110 | -85 | -340 | -234 | 87 | 224 | 264 | 21 |
| 2010's | 327 | -147 | -168 | 578 | 674 | 447 | 385 | -191 | 301 | -186 |
| 2020's | 247 | 74 | -291 | 520 | -224 |
| - = No Data Reported; -- = Not Applicable; NA = Not Available; W = Withheld to avoid disclosure of individual company data. |
| Release Date: 6/30/2026 |
| Next Release Date: 7/31/2026 |