|
Download Data (XLS File) |
|
|||||
|
|||||
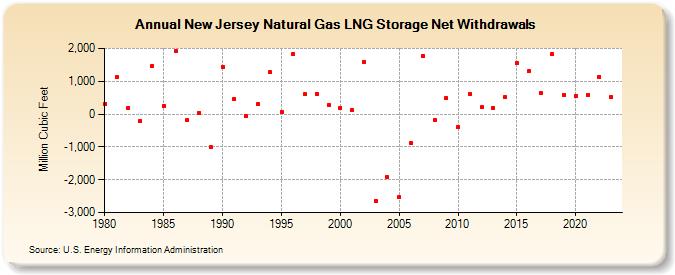
| New Jersey Natural Gas LNG Storage Net Withdrawals (Million Cubic Feet) | |||||
| Decade | Year-0 | Year-1 | Year-2 | Year-3 | Year-4 | Year-5 | Year-6 | Year-7 | Year-8 | Year-9 |
|---|---|---|---|---|---|---|---|---|---|---|
| 1980's | 317 | 1,117 | 189 | -209 | 1,468 | 253 | 1,916 | -185 | 40 | -1,011 |
| 1990's | 1,442 | 461 | -49 | 307 | 1,270 | 73 | 1,814 | 596 | 617 | 283 |
| 2000's | 187 | 112 | 1,596 | -2,634 | -1,929 | -2,534 | -894 | 1,776 | -178 | 494 |
| 2010's | -390 | 613 | 205 | 193 | 515 | 1,545 | 1,297 | 640 | 1,826 | 591 |
| 2020's | 547 | 593 | 1,135 | 512 | 425 |
| - = No Data Reported; -- = Not Applicable; NA = Not Available; W = Withheld to avoid disclosure of individual company data. |
| Release Date: 6/30/2026 |
| Next Release Date: 7/31/2026 |