|
Download Data (XLS File) |
|
|||||
|
|||||
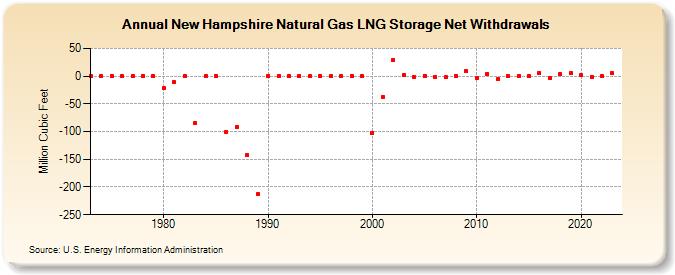
| New Hampshire Natural Gas LNG Storage Net Withdrawals (Million Cubic Feet) | |||||
| Decade | Year-0 | Year-1 | Year-2 | Year-3 | Year-4 | Year-5 | Year-6 | Year-7 | Year-8 | Year-9 |
|---|---|---|---|---|---|---|---|---|---|---|
| 1970's | 0 | 0 | 0 | 0 | 0 | 0 | 0 | |||
| 1980's | -22 | -11 | 0 | -84 | 0 | 0 | -100 | -91 | -142 | -213 |
| 1990's | 0 | 0 | 0 | 0 | 0 | 0 | 0 | 0 | 0 | 0 |
| 2000's | -102 | -37 | 29 | 2 | -1 | 1 | -1 | -2 | 1 | 9 |
| 2010's | -3 | 4 | -6 | 0 | 0 | 0 | 5 | -3 | 3 | 5 |
| 2020's | 2 | -1 | 0 | 5 | 190 |
| - = No Data Reported; -- = Not Applicable; NA = Not Available; W = Withheld to avoid disclosure of individual company data. |
| Release Date: 6/30/2026 |
| Next Release Date: 7/31/2026 |