|
Download Data (XLS File) |
|
|||||
|
|||||
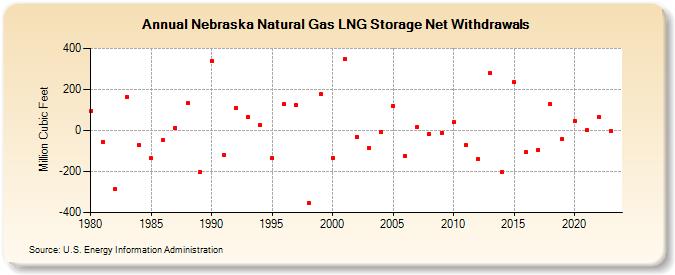
| Nebraska Natural Gas LNG Storage Net Withdrawals (Million Cubic Feet) | |||||
| Decade | Year-0 | Year-1 | Year-2 | Year-3 | Year-4 | Year-5 | Year-6 | Year-7 | Year-8 | Year-9 |
|---|---|---|---|---|---|---|---|---|---|---|
| 1980's | 95 | -54 | -286 | 162 | -70 | -136 | -48 | 14 | 132 | -204 |
| 1990's | 339 | -119 | 111 | 65 | 26 | -134 | 127 | 122 | -351 | 176 |
| 2000's | -132 | 348 | -31 | -83 | -8 | 121 | -122 | 18 | -15 | -10 |
| 2010's | 39 | -73 | -140 | 280 | -202 | 234 | -105 | -93 | 128 | -41 |
| 2020's | 45 | 0 | 65 | -2 | -316 |
| - = No Data Reported; -- = Not Applicable; NA = Not Available; W = Withheld to avoid disclosure of individual company data. |
| Release Date: 6/30/2026 |
| Next Release Date: 7/31/2026 |