|
Download Data (XLS File) |
|
|||||
|
|||||
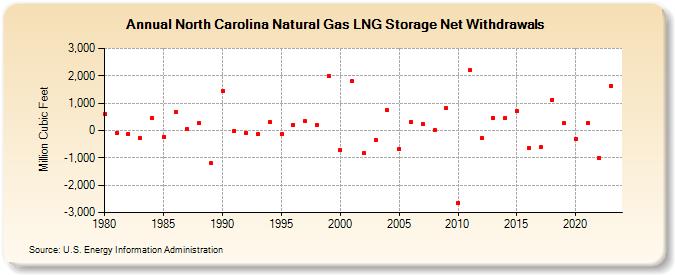
| North Carolina Natural Gas LNG Storage Net Withdrawals (Million Cubic Feet) | |||||
| Decade | Year-0 | Year-1 | Year-2 | Year-3 | Year-4 | Year-5 | Year-6 | Year-7 | Year-8 | Year-9 |
|---|---|---|---|---|---|---|---|---|---|---|
| 1980's | 597 | -94 | -111 | -282 | 448 | -233 | 686 | 39 | 261 | -1,205 |
| 1990's | 1,445 | -13 | -92 | -142 | 316 | -138 | 218 | 330 | 203 | 1,997 |
| 2000's | -722 | 1,797 | -834 | -343 | 734 | -684 | 313 | 222 | 3 | 811 |
| 2010's | -2,643 | 2,194 | -258 | 449 | 462 | 700 | -647 | -620 | 1,132 | 259 |
| 2020's | -311 | 276 | -998 | 1,637 | 174 |
| - = No Data Reported; -- = Not Applicable; NA = Not Available; W = Withheld to avoid disclosure of individual company data. |
| Release Date: 6/30/2026 |
| Next Release Date: 7/31/2026 |