|
Download Data (XLS File) |
|
|||||
|
|||||
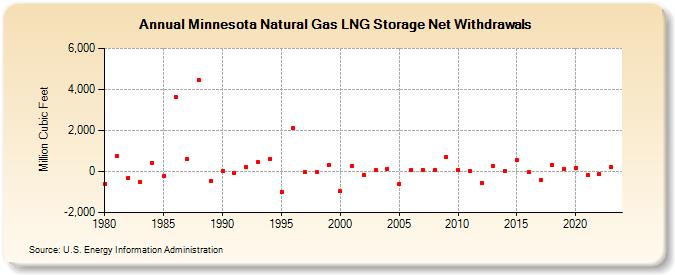
| Minnesota Natural Gas LNG Storage Net Withdrawals (Million Cubic Feet) | |||||
| Decade | Year-0 | Year-1 | Year-2 | Year-3 | Year-4 | Year-5 | Year-6 | Year-7 | Year-8 | Year-9 |
|---|---|---|---|---|---|---|---|---|---|---|
| 1980's | -589 | 739 | -295 | -493 | 431 | -234 | 3,636 | 621 | 4,442 | -462 |
| 1990's | 44 | -70 | 213 | 466 | 630 | -985 | 2,128 | -29 | -36 | 312 |
| 2000's | -964 | 265 | -160 | 81 | 128 | -588 | 93 | 82 | 65 | 703 |
| 2010's | 54 | 22 | -545 | 255 | 4 | 546 | -34 | -397 | 330 | 142 |
| 2020's | 187 | -173 | -130 | 222 | 141 |
| - = No Data Reported; -- = Not Applicable; NA = Not Available; W = Withheld to avoid disclosure of individual company data. |
| Release Date: 6/30/2026 |
| Next Release Date: 7/31/2026 |