|
Download Data (XLS File) |
|
|||||
|
|||||
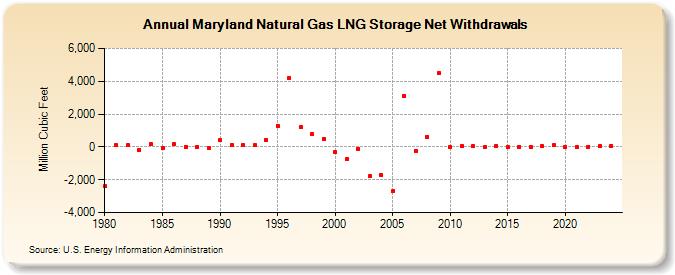
| Maryland Natural Gas LNG Storage Net Withdrawals (Million Cubic Feet) | |||||
| Decade | Year-0 | Year-1 | Year-2 | Year-3 | Year-4 | Year-5 | Year-6 | Year-7 | Year-8 | Year-9 |
|---|---|---|---|---|---|---|---|---|---|---|
| 1980's | -2,408 | 91 | 95 | -159 | 150 | -81 | 153 | 2 | -7 | -62 |
| 1990's | 392 | 126 | 89 | 85 | 410 | 1,291 | 4,190 | 1,186 | 785 | 494 |
| 2000's | -339 | -761 | -98 | -1,789 | -1,705 | -2,703 | 3,122 | -250 | 632 | 4,488 |
| 2010's | -13 | 42 | 27 | -5 | 41 | 4 | -5 | 20 | 28 | 86 |
| 2020's | 5 | -12 | 18 | 31 | 58 |
| - = No Data Reported; -- = Not Applicable; NA = Not Available; W = Withheld to avoid disclosure of individual company data. |
| Release Date: 6/30/2026 |
| Next Release Date: 7/31/2026 |