|
Download Data (XLS File) |
|
|||||
|
|||||
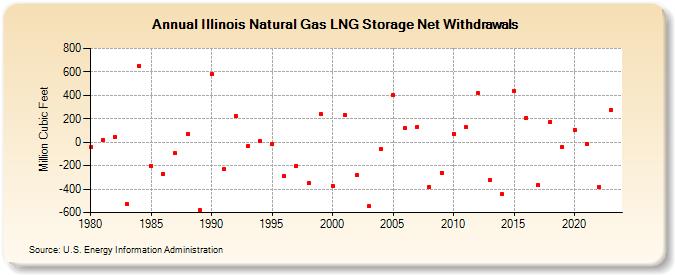
| Illinois Natural Gas LNG Storage Net Withdrawals (Million Cubic Feet) | |||||
| Decade | Year-0 | Year-1 | Year-2 | Year-3 | Year-4 | Year-5 | Year-6 | Year-7 | Year-8 | Year-9 |
|---|---|---|---|---|---|---|---|---|---|---|
| 1980's | -41 | 22 | 47 | -530 | 653 | -205 | -270 | -96 | 69 | -579 |
| 1990's | 580 | -229 | 222 | -31 | 9 | -12 | -289 | -200 | -351 | 241 |
| 2000's | -370 | 231 | -283 | -548 | -58 | 402 | 119 | 132 | -381 | -260 |
| 2010's | 74 | 127 | 419 | -322 | -442 | 437 | 209 | -368 | 175 | -40 |
| 2020's | 107 | -14 | -379 | 278 | 37 |
| - = No Data Reported; -- = Not Applicable; NA = Not Available; W = Withheld to avoid disclosure of individual company data. |
| Release Date: 6/30/2026 |
| Next Release Date: 7/31/2026 |