|
Download Data (XLS File) |
|
|||||
|
|||||
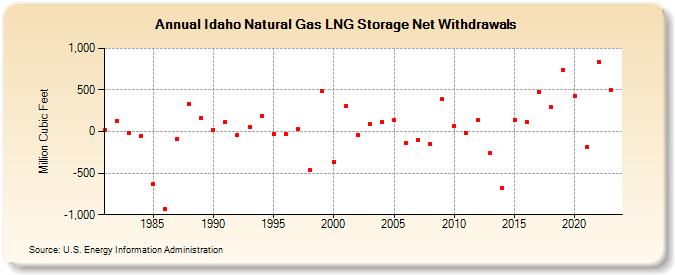
| Idaho Natural Gas LNG Storage Net Withdrawals (Million Cubic Feet) | |||||
| Decade | Year-0 | Year-1 | Year-2 | Year-3 | Year-4 | Year-5 | Year-6 | Year-7 | Year-8 | Year-9 |
|---|---|---|---|---|---|---|---|---|---|---|
| 1980's | 19 | 132 | -16 | -52 | -634 | -932 | -86 | 334 | 165 | |
| 1990's | 23 | 113 | -47 | 51 | 182 | -29 | -25 | 32 | -460 | 492 |
| 2000's | -361 | 307 | -42 | 91 | 120 | 143 | -140 | -99 | -147 | 387 |
| 2010's | 70 | -19 | 139 | -259 | -676 | 143 | 114 | 477 | 291 | 737 |
| 2020's | 430 | -182 | 840 | 500 | 492 |
| - = No Data Reported; -- = Not Applicable; NA = Not Available; W = Withheld to avoid disclosure of individual company data. |
| Release Date: 6/30/2026 |
| Next Release Date: 7/31/2026 |