|
Download Data (XLS File) |
|
|||||
|
|||||
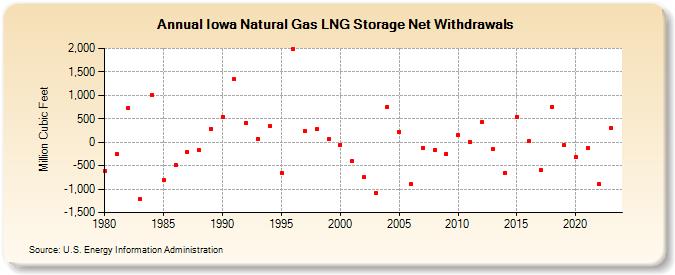
| Iowa Natural Gas LNG Storage Net Withdrawals (Million Cubic Feet) | |||||
| Decade | Year-0 | Year-1 | Year-2 | Year-3 | Year-4 | Year-5 | Year-6 | Year-7 | Year-8 | Year-9 |
|---|---|---|---|---|---|---|---|---|---|---|
| 1980's | -609 | -259 | 726 | -1,220 | 1,015 | -813 | -496 | -208 | -171 | 292 |
| 1990's | 541 | 1,343 | 412 | 75 | 346 | -651 | 1,978 | 241 | 280 | 72 |
| 2000's | -53 | -411 | -743 | -1,077 | 761 | 219 | -899 | -115 | -166 | -244 |
| 2010's | 146 | 14 | 428 | -151 | -647 | 546 | 16 | -583 | 760 | -61 |
| 2020's | -312 | -133 | -892 | 304 | -766 |
| - = No Data Reported; -- = Not Applicable; NA = Not Available; W = Withheld to avoid disclosure of individual company data. |
| Release Date: 6/30/2026 |
| Next Release Date: 7/31/2026 |