|
Download Data (XLS File) |
|
|||||
|
|||||
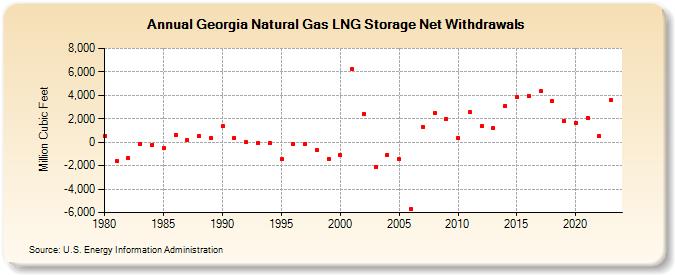
| Georgia Natural Gas LNG Storage Net Withdrawals (Million Cubic Feet) | |||||
| Decade | Year-0 | Year-1 | Year-2 | Year-3 | Year-4 | Year-5 | Year-6 | Year-7 | Year-8 | Year-9 |
|---|---|---|---|---|---|---|---|---|---|---|
| 1980's | 534 | -1,598 | -1,359 | -169 | -203 | -525 | 596 | 149 | 545 | 343 |
| 1990's | 1,345 | 390 | 16 | -42 | -94 | -1,464 | -189 | -153 | -698 | -1,403 |
| 2000's | -1,126 | 6,210 | 2,397 | -2,138 | -1,052 | -1,436 | -5,737 | 1,323 | 2,481 | 1,972 |
| 2010's | 379 | 2,542 | 1,378 | 1,205 | 3,085 | 3,826 | 3,970 | 4,334 | 3,505 | 1,845 |
| 2020's | 1,641 | 2,069 | 519 | 3,612 | 2,638 |
| - = No Data Reported; -- = Not Applicable; NA = Not Available; W = Withheld to avoid disclosure of individual company data. |
| Release Date: 6/30/2026 |
| Next Release Date: 7/31/2026 |