|
Download Data (XLS File) |
|
|||||
|
|||||
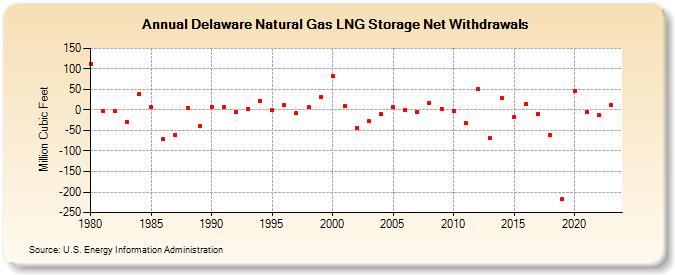
| Delaware Natural Gas LNG Storage Net Withdrawals (Million Cubic Feet) | |||||
| Decade | Year-0 | Year-1 | Year-2 | Year-3 | Year-4 | Year-5 | Year-6 | Year-7 | Year-8 | Year-9 |
|---|---|---|---|---|---|---|---|---|---|---|
| 1980's | 113 | -3 | -3 | -29 | 39 | 7 | -71 | -60 | 4 | -38 |
| 1990's | 6 | 7 | -5 | 3 | 23 | -1 | 11 | -8 | 8 | 31 |
| 2000's | 83 | 10 | -43 | -28 | -10 | 7 | -1 | -6 | 17 | 3 |
| 2010's | -2 | -31 | 51 | -68 | 29 | -17 | 14 | -11 | -62 | -218 |
| 2020's | 46 | -5 | -13 | 12 | -40 |
| - = No Data Reported; -- = Not Applicable; NA = Not Available; W = Withheld to avoid disclosure of individual company data. |
| Release Date: 6/30/2026 |
| Next Release Date: 7/31/2026 |