|
Download Data (XLS File) |
|
|||||
|
|||||
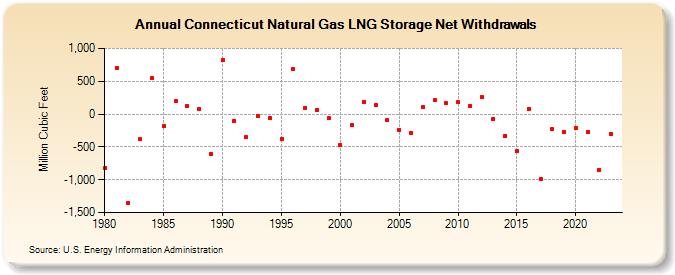
| Connecticut Natural Gas LNG Storage Net Withdrawals (Million Cubic Feet) | |||||
| Decade | Year-0 | Year-1 | Year-2 | Year-3 | Year-4 | Year-5 | Year-6 | Year-7 | Year-8 | Year-9 |
|---|---|---|---|---|---|---|---|---|---|---|
| 1980's | -820 | 701 | -1,356 | -385 | 544 | -187 | 198 | 121 | 75 | -604 |
| 1990's | 822 | -103 | -355 | -29 | -61 | -373 | 680 | 94 | 66 | -66 |
| 2000's | -471 | -169 | 182 | 140 | -91 | -240 | -286 | 102 | 207 | 164 |
| 2010's | 178 | 129 | 260 | -68 | -327 | -558 | 83 | -988 | -233 | -274 |
| 2020's | -211 | -271 | -847 | -306 | -140 |
| - = No Data Reported; -- = Not Applicable; NA = Not Available; W = Withheld to avoid disclosure of individual company data. |
| Release Date: 6/30/2026 |
| Next Release Date: 7/31/2026 |