|
Download Data (XLS File) |
|
|||||
|
|||||
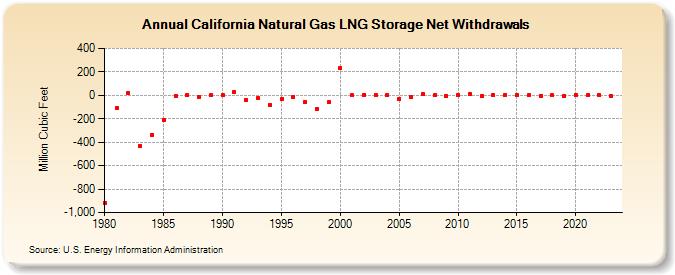
| California Natural Gas LNG Storage Net Withdrawals (Million Cubic Feet) | |||||
| Decade | Year-0 | Year-1 | Year-2 | Year-3 | Year-4 | Year-5 | Year-6 | Year-7 | Year-8 | Year-9 |
|---|---|---|---|---|---|---|---|---|---|---|
| 1980's | -916 | -105 | 19 | -430 | -335 | -207 | -5 | 0 | -11 | 0 |
| 1990's | 0 | 32 | -38 | -24 | -80 | -33 | -13 | -58 | -114 | -59 |
| 2000's | 234 | -1 | 4 | 3 | -1 | -31 | -16 | 10 | -1 | -5 |
| 2010's | 2 | 7 | -5 | 3 | 1 | 2 | -1 | -2 | -1 | -5 |
| 2020's | 5 | -1 | 1 | -7 | -33 |
| - = No Data Reported; -- = Not Applicable; NA = Not Available; W = Withheld to avoid disclosure of individual company data. |
| Release Date: 5/29/2026 |
| Next Release Date: 6/30/2026 |