|
Download Data (XLS File) |
|
|||||
|
|||||
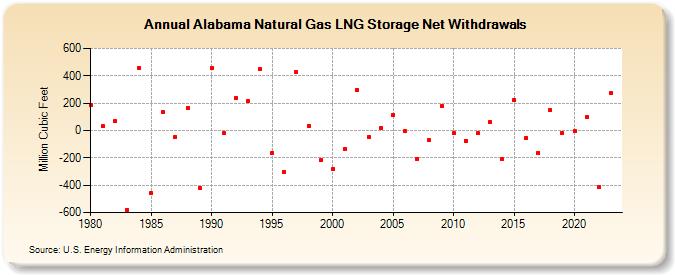
| Alabama Natural Gas LNG Storage Net Withdrawals (Million Cubic Feet) | |||||
| Decade | Year-0 | Year-1 | Year-2 | Year-3 | Year-4 | Year-5 | Year-6 | Year-7 | Year-8 | Year-9 |
|---|---|---|---|---|---|---|---|---|---|---|
| 1980's | 185 | 30 | 66 | -580 | 459 | -459 | 132 | -46 | 164 | -422 |
| 1990's | 456 | -19 | 239 | 215 | 448 | -164 | -303 | 425 | 32 | -219 |
| 2000's | -285 | -136 | 298 | -47 | 19 | 114 | -7 | -209 | -73 | 178 |
| 2010's | -21 | -75 | -22 | 63 | -206 | 226 | -52 | -162 | 149 | -21 |
| 2020's | -6 | 98 | -415 | 273 | 4 |
| - = No Data Reported; -- = Not Applicable; NA = Not Available; W = Withheld to avoid disclosure of individual company data. |
| Release Date: 6/30/2026 |
| Next Release Date: 7/31/2026 |