|
Download Data (XLS File) |
|
|||||
|
|||||
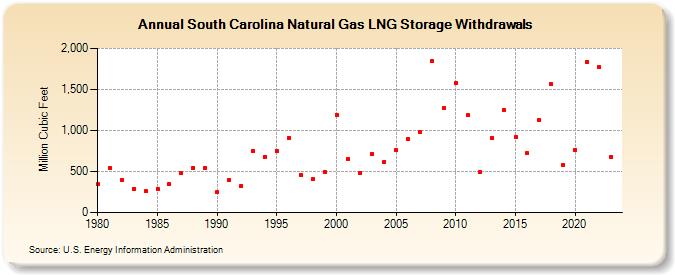
| South Carolina Natural Gas LNG Storage Withdrawals (Million Cubic Feet) | |||||
| Decade | Year-0 | Year-1 | Year-2 | Year-3 | Year-4 | Year-5 | Year-6 | Year-7 | Year-8 | Year-9 |
|---|---|---|---|---|---|---|---|---|---|---|
| 1980's | 342 | 546 | 401 | 292 | 258 | 293 | 342 | 481 | 547 | 547 |
| 1990's | 247 | 396 | 323 | 752 | 682 | 754 | 910 | 461 | 406 | 493 |
| 2000's | 1,194 | 651 | 488 | 718 | 622 | 757 | 892 | 987 | 1,847 | 1,268 |
| 2010's | 1,574 | 1,183 | 491 | 914 | 1,252 | 916 | 720 | 1,125 | 1,561 | 577 |
| 2020's | 764 | 1,835 | 1,771 | 681 | 1,722 |
| - = No Data Reported; -- = Not Applicable; NA = Not Available; W = Withheld to avoid disclosure of individual company data. |
| Release Date: 6/30/2026 |
| Next Release Date: 7/31/2026 |