|
Download Data (XLS File) |
|
|||||
|
|||||
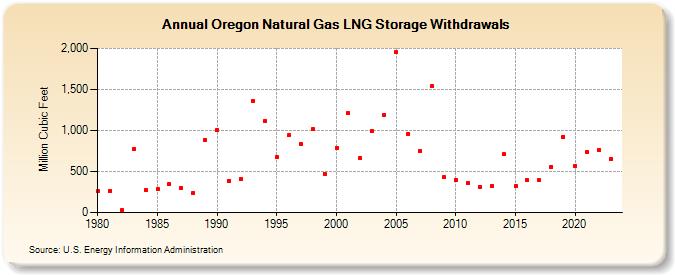
| Oregon Natural Gas LNG Storage Withdrawals (Million Cubic Feet) | |||||
| Decade | Year-0 | Year-1 | Year-2 | Year-3 | Year-4 | Year-5 | Year-6 | Year-7 | Year-8 | Year-9 |
|---|---|---|---|---|---|---|---|---|---|---|
| 1980's | 264 | 268 | 29 | 773 | 272 | 283 | 346 | 305 | 243 | 890 |
| 1990's | 1,003 | 389 | 409 | 1,360 | 1,117 | 675 | 939 | 841 | 1,014 | 468 |
| 2000's | 789 | 1,215 | 664 | 992 | 1,190 | 1,950 | 959 | 749 | 1,537 | 436 |
| 2010's | 396 | 361 | 315 | 326 | 711 | 321 | 392 | 391 | 561 | 926 |
| 2020's | 572 | 733 | 763 | 655 | 393 |
| - = No Data Reported; -- = Not Applicable; NA = Not Available; W = Withheld to avoid disclosure of individual company data. |
| Release Date: 6/30/2026 |
| Next Release Date: 7/31/2026 |