|
Download Data (XLS File) |
|
|||||
|
|||||
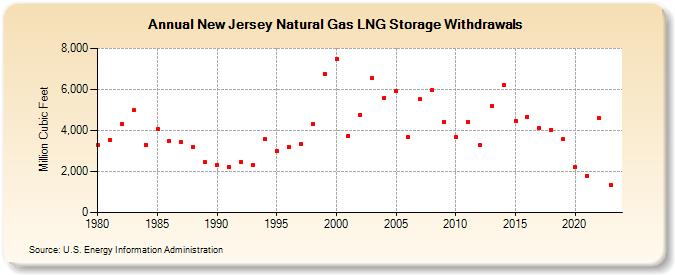
| New Jersey Natural Gas LNG Storage Withdrawals (Million Cubic Feet) | |||||
| Decade | Year-0 | Year-1 | Year-2 | Year-3 | Year-4 | Year-5 | Year-6 | Year-7 | Year-8 | Year-9 |
|---|---|---|---|---|---|---|---|---|---|---|
| 1980's | 3,300 | 3,541 | 4,329 | 4,979 | 3,313 | 4,064 | 3,468 | 3,422 | 3,202 | 2,444 |
| 1990's | 2,298 | 2,221 | 2,471 | 2,313 | 3,565 | 2,982 | 3,219 | 3,330 | 4,305 | 6,752 |
| 2000's | 7,501 | 3,732 | 4,778 | 6,554 | 5,603 | 5,915 | 3,680 | 5,513 | 5,971 | 4,425 |
| 2010's | 3,693 | 4,404 | 3,278 | 5,208 | 6,218 | 4,452 | 4,674 | 4,104 | 4,047 | 3,584 |
| 2020's | 2,223 | 1,782 | 4,607 | 1,343 | 1,167 |
| - = No Data Reported; -- = Not Applicable; NA = Not Available; W = Withheld to avoid disclosure of individual company data. |
| Release Date: 6/30/2026 |
| Next Release Date: 7/31/2026 |