|
Download Data (XLS File) |
|
|||||
|
|||||
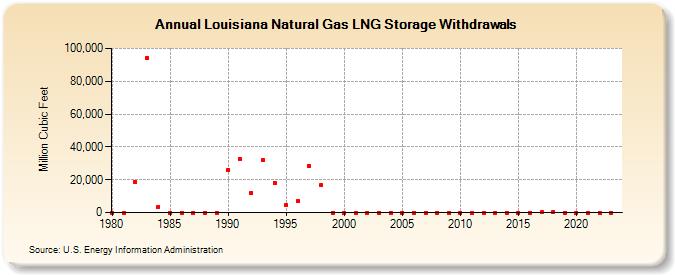
| Louisiana Natural Gas LNG Storage Withdrawals (Million Cubic Feet) | |||||
| Decade | Year-0 | Year-1 | Year-2 | Year-3 | Year-4 | Year-5 | Year-6 | Year-7 | Year-8 | Year-9 |
|---|---|---|---|---|---|---|---|---|---|---|
| 1980's | 0 | 0 | 18,720 | 94,323 | 3,556 | 0 | 0 | 0 | 0 | 0 |
| 1990's | 26,206 | 32,726 | 12,097 | 32,033 | 18,252 | 4,723 | 7,056 | 28,245 | 16,515 | 0 |
| 2000's | 0 | 0 | 0 | 0 | 0 | 0 | 0 | 0 | 0 | 0 |
| 2010's | 0 | 0 | 0 | 0 | 24 | 23 | 22 | 150 | 535 | 0 |
| 2020's | 0 | 0 | 0 | 0 | 0 |
| - = No Data Reported; -- = Not Applicable; NA = Not Available; W = Withheld to avoid disclosure of individual company data. |
| Release Date: 6/30/2026 |
| Next Release Date: 7/31/2026 |