|
Download Data (XLS File) |
|
|||||
|
|||||
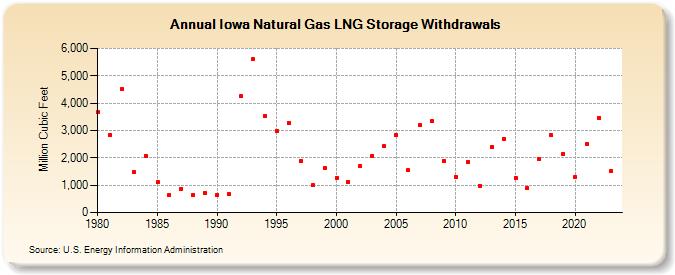
| Iowa Natural Gas LNG Storage Withdrawals (Million Cubic Feet) | |||||
| Decade | Year-0 | Year-1 | Year-2 | Year-3 | Year-4 | Year-5 | Year-6 | Year-7 | Year-8 | Year-9 |
|---|---|---|---|---|---|---|---|---|---|---|
| 1980's | 3,672 | 2,835 | 4,517 | 1,476 | 2,074 | 1,102 | 650 | 878 | 648 | 715 |
| 1990's | 655 | 669 | 4,247 | 5,597 | 3,521 | 2,996 | 3,284 | 1,893 | 989 | 1,624 |
| 2000's | 1,279 | 1,112 | 1,687 | 2,075 | 2,427 | 2,845 | 1,540 | 3,195 | 3,344 | 1,897 |
| 2010's | 1,312 | 1,844 | 980 | 2,403 | 2,701 | 1,280 | 897 | 1,953 | 2,825 | 2,149 |
| 2020's | 1,312 | 2,508 | 3,473 | 1,532 | 1,528 |
| - = No Data Reported; -- = Not Applicable; NA = Not Available; W = Withheld to avoid disclosure of individual company data. |
| Release Date: 6/30/2026 |
| Next Release Date: 7/31/2026 |