|
Download Data (XLS File) |
|
|||||
|
|||||
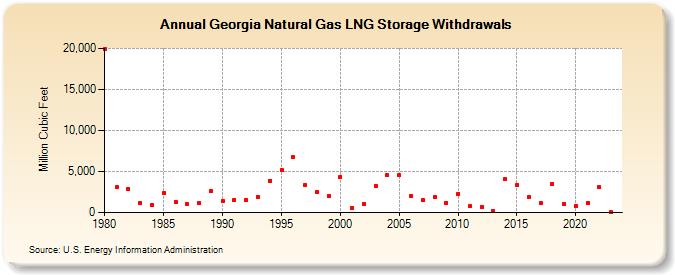
| Georgia Natural Gas LNG Storage Withdrawals (Million Cubic Feet) | |||||
| Decade | Year-0 | Year-1 | Year-2 | Year-3 | Year-4 | Year-5 | Year-6 | Year-7 | Year-8 | Year-9 |
|---|---|---|---|---|---|---|---|---|---|---|
| 1980's | 19,950 | 3,106 | 2,914 | 1,193 | 881 | 2,359 | 1,346 | 1,001 | 1,157 | 2,586 |
| 1990's | 1,435 | 1,579 | 1,557 | 1,896 | 3,881 | 5,210 | 6,712 | 3,374 | 2,458 | 2,010 |
| 2000's | 4,367 | 562 | 1,029 | 3,283 | 4,518 | 4,535 | 1,968 | 1,493 | 1,891 | 1,210 |
| 2010's | 2,314 | 764 | 719 | 180 | 4,046 | 3,339 | 1,841 | 1,193 | 3,487 | 1,042 |
| 2020's | 810 | 1,185 | 3,062 | 21 | 2,038 |
| - = No Data Reported; -- = Not Applicable; NA = Not Available; W = Withheld to avoid disclosure of individual company data. |
| Release Date: 6/30/2026 |
| Next Release Date: 7/31/2026 |