|
Download Data (XLS File) |
|
|||||
|
|||||
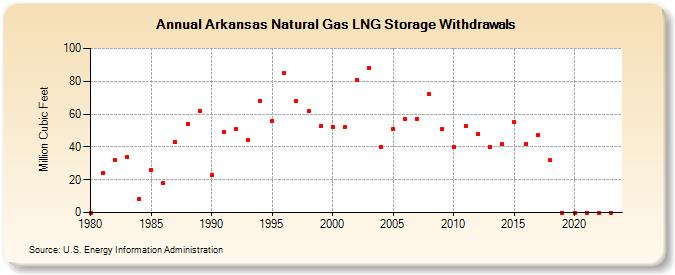
| Arkansas Natural Gas LNG Storage Withdrawals (Million Cubic Feet) | |||||
| Decade | Year-0 | Year-1 | Year-2 | Year-3 | Year-4 | Year-5 | Year-6 | Year-7 | Year-8 | Year-9 |
|---|---|---|---|---|---|---|---|---|---|---|
| 1980's | 0 | 24 | 32 | 34 | 8 | 26 | 18 | 43 | 54 | 62 |
| 1990's | 23 | 49 | 51 | 44 | 68 | 56 | 85 | 68 | 62 | 53 |
| 2000's | 52 | 52 | 81 | 88 | 40 | 51 | 57 | 57 | 72 | 51 |
| 2010's | 40 | 53 | 48 | 40 | 42 | 55 | 42 | 47 | 32 | 0 |
| 2020's | 0 | 0 | 0 | 0 | 0 |
| - = No Data Reported; -- = Not Applicable; NA = Not Available; W = Withheld to avoid disclosure of individual company data. |
| Release Date: 6/30/2026 |
| Next Release Date: 7/31/2026 |