|
Download Data (XLS File) |
|
|||||
|
|||||
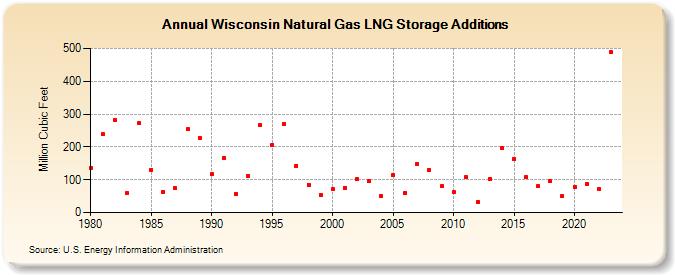
| Wisconsin Natural Gas LNG Storage Additions (Million Cubic Feet) | |||||
| Decade | Year-0 | Year-1 | Year-2 | Year-3 | Year-4 | Year-5 | Year-6 | Year-7 | Year-8 | Year-9 |
|---|---|---|---|---|---|---|---|---|---|---|
| 1980's | 136 | 238 | 283 | 60 | 272 | 131 | 64 | 74 | 253 | 228 |
| 1990's | 116 | 167 | 57 | 112 | 266 | 206 | 269 | 143 | 85 | 53 |
| 2000's | 71 | 76 | 102 | 95 | 49 | 114 | 60 | 148 | 130 | 80 |
| 2010's | 63 | 107 | 33 | 103 | 196 | 163 | 107 | 80 | 95 | 49 |
| 2020's | 79 | 86 | 71 | 488 | 1,211 |
| - = No Data Reported; -- = Not Applicable; NA = Not Available; W = Withheld to avoid disclosure of individual company data. |
| Release Date: 6/30/2026 |
| Next Release Date: 7/31/2026 |