|
Download Data (XLS File) |
|
|||||
|
|||||
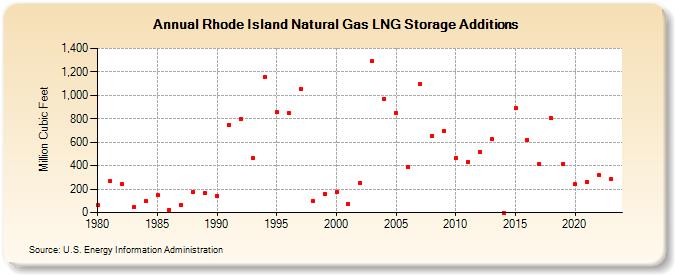
| Rhode Island Natural Gas LNG Storage Additions (Million Cubic Feet) | |||||
| Decade | Year-0 | Year-1 | Year-2 | Year-3 | Year-4 | Year-5 | Year-6 | Year-7 | Year-8 | Year-9 |
|---|---|---|---|---|---|---|---|---|---|---|
| 1980's | 61 | 265 | 243 | 47 | 97 | 147 | 20 | 65 | 174 | 164 |
| 1990's | 142 | 749 | 796 | 462 | 1,156 | 857 | 850 | 1,056 | 102 | 162 |
| 2000's | 174 | 72 | 254 | 1,290 | 971 | 850 | 390 | 1,093 | 656 | 698 |
| 2010's | 468 | 430 | 517 | 624 | 0 | 889 | 622 | 413 | 804 | 417 |
| 2020's | 240 | 263 | 319 | 289 | 60 |
| - = No Data Reported; -- = Not Applicable; NA = Not Available; W = Withheld to avoid disclosure of individual company data. |
| Release Date: 6/30/2026 |
| Next Release Date: 7/31/2026 |