|
Download Data (XLS File) |
|
|||||
|
|||||
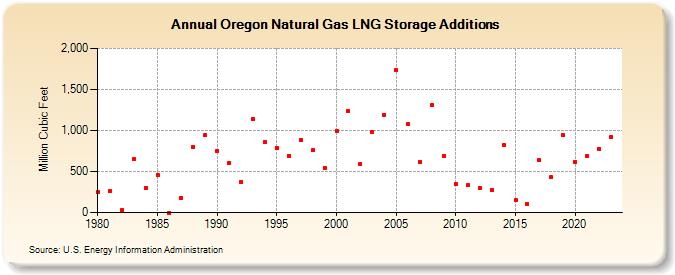
| Oregon Natural Gas LNG Storage Additions (Million Cubic Feet) | |||||
| Decade | Year-0 | Year-1 | Year-2 | Year-3 | Year-4 | Year-5 | Year-6 | Year-7 | Year-8 | Year-9 |
|---|---|---|---|---|---|---|---|---|---|---|
| 1980's | 251 | 265 | 28 | 649 | 304 | 461 | 0 | 183 | 803 | 940 |
| 1990's | 754 | 609 | 376 | 1,137 | 860 | 790 | 693 | 889 | 757 | 540 |
| 2000's | 997 | 1,234 | 594 | 977 | 1,193 | 1,733 | 1,078 | 613 | 1,315 | 683 |
| 2010's | 343 | 336 | 299 | 276 | 822 | 149 | 104 | 636 | 430 | 944 |
| 2020's | 620 | 684 | 776 | 918 | 373 |
| - = No Data Reported; -- = Not Applicable; NA = Not Available; W = Withheld to avoid disclosure of individual company data. |
| Release Date: 6/30/2026 |
| Next Release Date: 7/31/2026 |