|
Download Data (XLS File) |
|
|||||
|
|||||
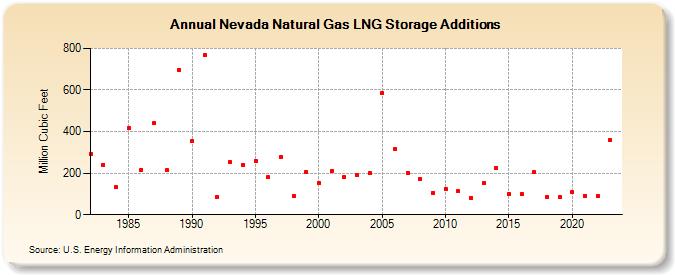
| Nevada Natural Gas LNG Storage Additions (Million Cubic Feet) | |||||
| Decade | Year-0 | Year-1 | Year-2 | Year-3 | Year-4 | Year-5 | Year-6 | Year-7 | Year-8 | Year-9 |
|---|---|---|---|---|---|---|---|---|---|---|
| 1980's | 294 | 241 | 133 | 419 | 217 | 441 | 213 | 696 | ||
| 1990's | 356 | 767 | 83 | 253 | 241 | 259 | 180 | 276 | 92 | 206 |
| 2000's | 153 | 211 | 181 | 193 | 199 | 587 | 316 | 202 | 174 | 106 |
| 2010's | 125 | 112 | 82 | 153 | 227 | 101 | 100 | 204 | 86 | 83 |
| 2020's | 108 | 92 | 91 | 359 | 99 |
| - = No Data Reported; -- = Not Applicable; NA = Not Available; W = Withheld to avoid disclosure of individual company data. |
| Release Date: 6/30/2026 |
| Next Release Date: 7/31/2026 |