|
Download Data (XLS File) |
|
|||||
|
|||||
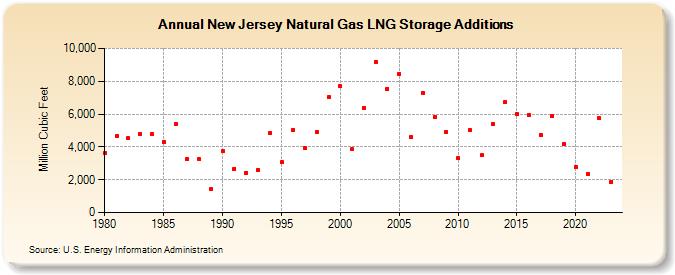
| New Jersey Natural Gas LNG Storage Additions (Million Cubic Feet) | |||||
| Decade | Year-0 | Year-1 | Year-2 | Year-3 | Year-4 | Year-5 | Year-6 | Year-7 | Year-8 | Year-9 |
|---|---|---|---|---|---|---|---|---|---|---|
| 1980's | 3,617 | 4,658 | 4,518 | 4,770 | 4,781 | 4,317 | 5,384 | 3,236 | 3,243 | 1,433 |
| 1990's | 3,740 | 2,683 | 2,422 | 2,620 | 4,835 | 3,055 | 5,033 | 3,926 | 4,922 | 7,035 |
| 2000's | 7,688 | 3,844 | 6,373 | 9,189 | 7,532 | 8,448 | 4,574 | 7,290 | 5,792 | 4,919 |
| 2010's | 3,304 | 5,018 | 3,483 | 5,401 | 6,733 | 5,997 | 5,971 | 4,744 | 5,873 | 4,175 |
| 2020's | 2,770 | 2,375 | 5,741 | 1,856 | 1,592 |
| - = No Data Reported; -- = Not Applicable; NA = Not Available; W = Withheld to avoid disclosure of individual company data. |
| Release Date: 6/30/2026 |
| Next Release Date: 7/31/2026 |