|
Download Data (XLS File) |
|
|||||
|
|||||
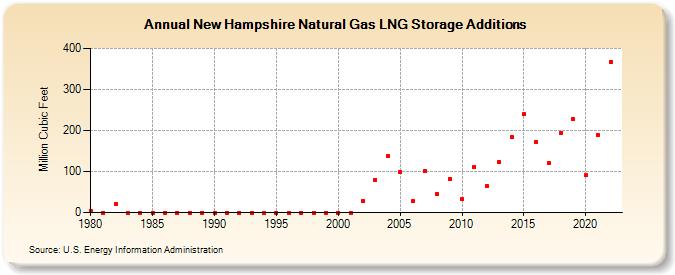
| New Hampshire Natural Gas LNG Storage Additions (Million Cubic Feet) | |||||
| Decade | Year-0 | Year-1 | Year-2 | Year-3 | Year-4 | Year-5 | Year-6 | Year-7 | Year-8 | Year-9 |
|---|---|---|---|---|---|---|---|---|---|---|
| 1980's | 5 | 0 | 21 | 0 | 0 | 0 | 0 | 0 | 0 | 0 |
| 1990's | 0 | 0 | 0 | 0 | 0 | 0 | 0 | 0 | 0 | 0 |
| 2000's | 0 | 0 | 29 | 80 | 138 | 99 | 27 | 101 | 45 | 82 |
| 2010's | 33 | 112 | 65 | 124 | 185 | 240 | 172 | 121 | 195 | 227 |
| 2020's | 91 | 189 | 368 | 339 | 374 |
| - = No Data Reported; -- = Not Applicable; NA = Not Available; W = Withheld to avoid disclosure of individual company data. |
| Release Date: 6/30/2026 |
| Next Release Date: 7/31/2026 |