|
Download Data (XLS File) |
|
|||||
|
|||||
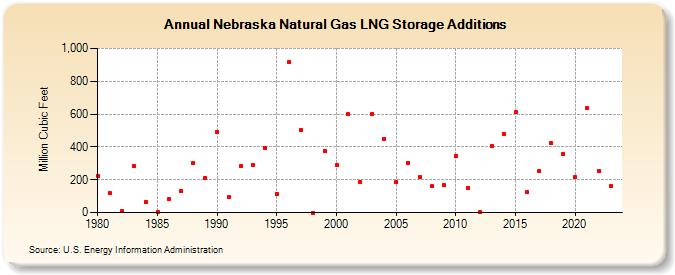
| Nebraska Natural Gas LNG Storage Additions (Million Cubic Feet) | |||||
| Decade | Year-0 | Year-1 | Year-2 | Year-3 | Year-4 | Year-5 | Year-6 | Year-7 | Year-8 | Year-9 |
|---|---|---|---|---|---|---|---|---|---|---|
| 1980's | 225 | 119 | 7 | 283 | 65 | 4 | 81 | 130 | 299 | 210 |
| 1990's | 493 | 92 | 283 | 287 | 393 | 115 | 915 | 505 | 0 | 377 |
| 2000's | 288 | 598 | 187 | 601 | 449 | 185 | 303 | 214 | 159 | 165 |
| 2010's | 346 | 147 | 1 | 407 | 481 | 611 | 125 | 252 | 422 | 356 |
| 2020's | 217 | 635 | 254 | 161 | 95 |
| - = No Data Reported; -- = Not Applicable; NA = Not Available; W = Withheld to avoid disclosure of individual company data. |
| Release Date: 6/30/2026 |
| Next Release Date: 7/31/2026 |