|
Download Data (XLS File) |
|
|||||
|
|||||
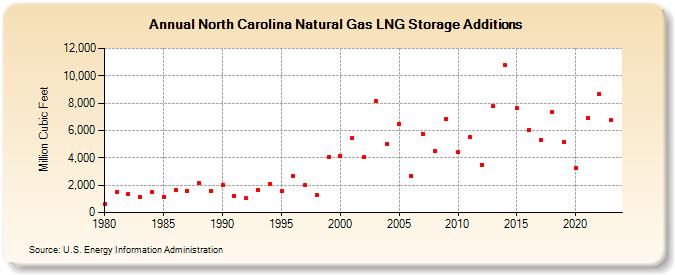
| North Carolina Natural Gas LNG Storage Additions (Million Cubic Feet) | |||||
| Decade | Year-0 | Year-1 | Year-2 | Year-3 | Year-4 | Year-5 | Year-6 | Year-7 | Year-8 | Year-9 |
|---|---|---|---|---|---|---|---|---|---|---|
| 1980's | 597 | 1,497 | 1,372 | 1,145 | 1,511 | 1,164 | 1,663 | 1,609 | 2,151 | 1,597 |
| 1990's | 2,023 | 1,219 | 1,030 | 1,681 | 2,118 | 1,572 | 2,708 | 2,016 | 1,286 | 4,086 |
| 2000's | 4,168 | 5,477 | 4,026 | 8,122 | 5,039 | 6,445 | 2,639 | 5,744 | 4,493 | 6,838 |
| 2010's | 4,410 | 5,500 | 3,504 | 7,765 | 10,765 | 7,617 | 6,055 | 5,337 | 7,333 | 5,175 |
| 2020's | 3,226 | 6,897 | 8,680 | 6,799 | 5,638 |
| - = No Data Reported; -- = Not Applicable; NA = Not Available; W = Withheld to avoid disclosure of individual company data. |
| Release Date: 6/30/2026 |
| Next Release Date: 7/31/2026 |