|
Download Data (XLS File) |
|
|||||
|
|||||
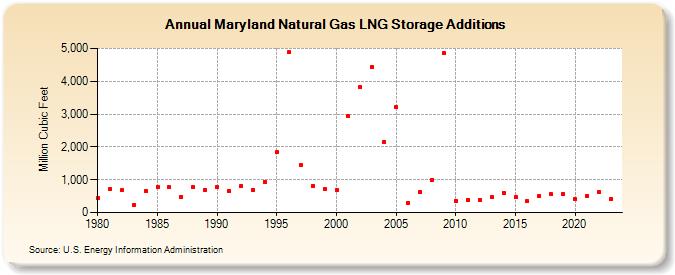
| Maryland Natural Gas LNG Storage Additions (Million Cubic Feet) | |||||
| Decade | Year-0 | Year-1 | Year-2 | Year-3 | Year-4 | Year-5 | Year-6 | Year-7 | Year-8 | Year-9 |
|---|---|---|---|---|---|---|---|---|---|---|
| 1980's | 443 | 714 | 676 | 235 | 650 | 786 | 769 | 482 | 764 | 697 |
| 1990's | 769 | 657 | 804 | 696 | 939 | 1,831 | 4,881 | 1,439 | 813 | 715 |
| 2000's | 684 | 2,926 | 3,814 | 4,437 | 2,157 | 3,203 | 296 | 631 | 1,002 | 4,859 |
| 2010's | 366 | 394 | 386 | 461 | 604 | 467 | 348 | 513 | 553 | 567 |
| 2020's | 412 | 519 | 635 | 420 | 458 |
| - = No Data Reported; -- = Not Applicable; NA = Not Available; W = Withheld to avoid disclosure of individual company data. |
| Release Date: 6/30/2026 |
| Next Release Date: 7/31/2026 |