|
Download Data (XLS File) |
|
|||||
|
|||||
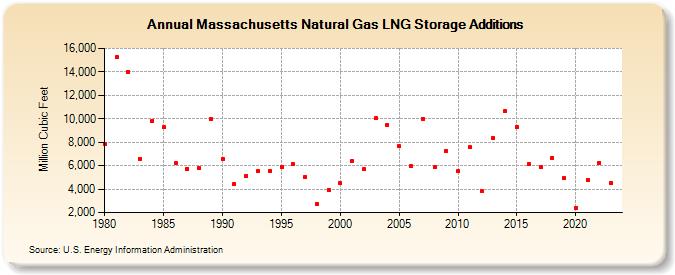
| Massachusetts Natural Gas LNG Storage Additions (Million Cubic Feet) | |||||
| Decade | Year-0 | Year-1 | Year-2 | Year-3 | Year-4 | Year-5 | Year-6 | Year-7 | Year-8 | Year-9 |
|---|---|---|---|---|---|---|---|---|---|---|
| 1980's | 7,885 | 15,234 | 14,021 | 6,599 | 9,844 | 9,261 | 6,184 | 5,732 | 5,782 | 10,004 |
| 1990's | 6,586 | 4,399 | 5,147 | 5,531 | 5,550 | 5,898 | 6,107 | 5,049 | 2,712 | 3,934 |
| 2000's | 4,480 | 6,382 | 5,683 | 10,035 | 9,485 | 7,643 | 5,966 | 10,006 | 5,863 | 7,244 |
| 2010's | 5,507 | 7,558 | 3,805 | 8,339 | 10,621 | 9,311 | 6,125 | 5,873 | 6,693 | 4,906 |
| 2020's | 2,405 | 4,757 | 6,260 | 4,508 | 3,876 |
| - = No Data Reported; -- = Not Applicable; NA = Not Available; W = Withheld to avoid disclosure of individual company data. |
| Release Date: 6/30/2026 |
| Next Release Date: 7/31/2026 |