|
Download Data (XLS File) |
|
|||||
|
|||||
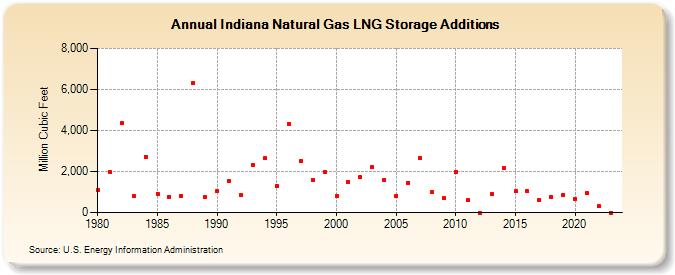
| Indiana Natural Gas LNG Storage Additions (Million Cubic Feet) | |||||
| Decade | Year-0 | Year-1 | Year-2 | Year-3 | Year-4 | Year-5 | Year-6 | Year-7 | Year-8 | Year-9 |
|---|---|---|---|---|---|---|---|---|---|---|
| 1980's | 1,107 | 1,966 | 4,352 | 785 | 2,714 | 923 | 777 | 806 | 6,321 | 737 |
| 1990's | 1,027 | 1,517 | 849 | 2,320 | 2,638 | 1,316 | 4,337 | 2,520 | 1,589 | 2,000 |
| 2000's | 795 | 1,477 | 1,726 | 2,197 | 1,602 | 831 | 1,447 | 2,663 | 982 | 691 |
| 2010's | 1,983 | 609 | 0 | 925 | 2,193 | 1,035 | 1,038 | 608 | 744 | 858 |
| 2020's | 670 | 963 | 302 | 0 | 0 |
| - = No Data Reported; -- = Not Applicable; NA = Not Available; W = Withheld to avoid disclosure of individual company data. |
| Release Date: 6/30/2026 |
| Next Release Date: 7/31/2026 |