|
Download Data (XLS File) |
|
|||||
|
|||||
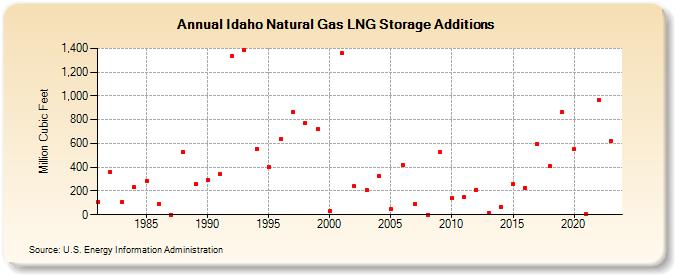
| Idaho Natural Gas LNG Storage Additions (Million Cubic Feet) | |||||
| Decade | Year-0 | Year-1 | Year-2 | Year-3 | Year-4 | Year-5 | Year-6 | Year-7 | Year-8 | Year-9 |
|---|---|---|---|---|---|---|---|---|---|---|
| 1980's | 110 | 361 | 110 | 230 | 287 | 93 | 0 | 528 | 258 | |
| 1990's | 291 | 340 | 1,338 | 1,389 | 554 | 405 | 636 | 868 | 776 | 720 |
| 2000's | 29 | 1,358 | 239 | 210 | 330 | 46 | 415 | 89 | 0 | 528 |
| 2010's | 142 | 146 | 211 | 13 | 64 | 260 | 227 | 597 | 409 | 861 |
| 2020's | 551 | 5 | 967 | 618 | 624 |
| - = No Data Reported; -- = Not Applicable; NA = Not Available; W = Withheld to avoid disclosure of individual company data. |
| Release Date: 5/29/2026 |
| Next Release Date: 6/30/2026 |