|
Download Data (XLS File) |
|
|||||
|
|||||
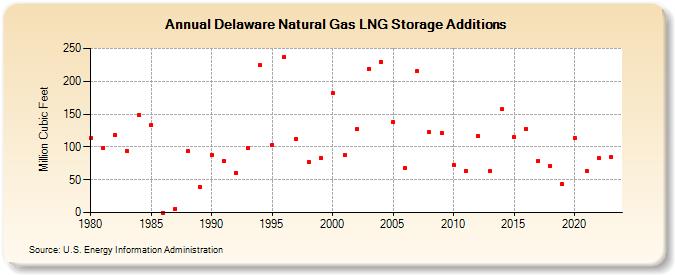
| Delaware Natural Gas LNG Storage Additions (Million Cubic Feet) | |||||
| Decade | Year-0 | Year-1 | Year-2 | Year-3 | Year-4 | Year-5 | Year-6 | Year-7 | Year-8 | Year-9 |
|---|---|---|---|---|---|---|---|---|---|---|
| 1980's | 113 | 99 | 118 | 94 | 149 | 133 | 0 | 6 | 93 | 39 |
| 1990's | 88 | 79 | 61 | 99 | 225 | 103 | 237 | 112 | 77 | 83 |
| 2000's | 182 | 88 | 127 | 219 | 230 | 138 | 68 | 215 | 122 | 121 |
| 2010's | 73 | 64 | 117 | 63 | 157 | 115 | 128 | 79 | 71 | 43 |
| 2020's | 114 | 64 | 83 | 84 | 62 |
| - = No Data Reported; -- = Not Applicable; NA = Not Available; W = Withheld to avoid disclosure of individual company data. |
| Release Date: 6/30/2026 |
| Next Release Date: 7/31/2026 |