|
Download Data (XLS File) |
|
|||||
|
|||||
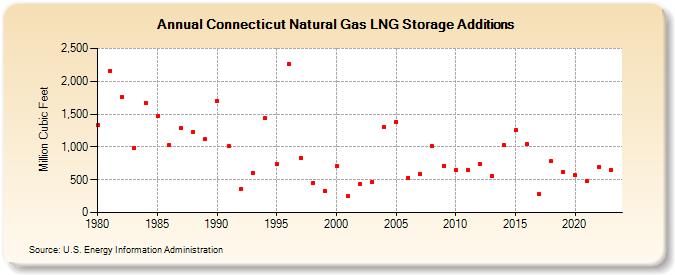
| Connecticut Natural Gas LNG Storage Additions (Million Cubic Feet) | |||||
| Decade | Year-0 | Year-1 | Year-2 | Year-3 | Year-4 | Year-5 | Year-6 | Year-7 | Year-8 | Year-9 |
|---|---|---|---|---|---|---|---|---|---|---|
| 1980's | 1,336 | 2,160 | 1,766 | 980 | 1,673 | 1,466 | 1,035 | 1,281 | 1,229 | 1,115 |
| 1990's | 1,696 | 1,010 | 359 | 610 | 1,435 | 736 | 2,265 | 832 | 447 | 334 |
| 2000's | 707 | 245 | 438 | 468 | 1,299 | 1,383 | 532 | 587 | 1,008 | 713 |
| 2010's | 651 | 655 | 743 | 558 | 1,032 | 1,252 | 1,039 | 277 | 785 | 624 |
| 2020's | 571 | 488 | 700 | 654 | 900 |
| - = No Data Reported; -- = Not Applicable; NA = Not Available; W = Withheld to avoid disclosure of individual company data. |
| Release Date: 6/30/2026 |
| Next Release Date: 7/31/2026 |