|
Download Data (XLS File) |
|
|||||
|
|||||
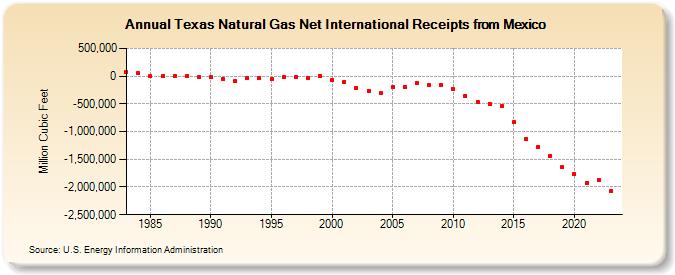
| Texas Natural Gas Net International Receipts from Mexico (Million Cubic Feet) | |||||
| Decade | Year-0 | Year-1 | Year-2 | Year-3 | Year-4 | Year-5 | Year-6 | Year-7 | Year-8 | Year-9 |
|---|---|---|---|---|---|---|---|---|---|---|
| 1980's | 75,361 | 51,473 | -394 | -372 | -368 | -422 | -15,535 | |||
| 1990's | -13,983 | -58,851 | -93,408 | -34,745 | -37,029 | -54,519 | -16,573 | -16,920 | -32,401 | 1,270 |
| 2000's | -71,667 | -98,787 | -209,220 | -272,716 | -309,439 | -198,513 | -192,558 | -124,835 | -167,773 | -166,574 |
| 2010's | -237,699 | -357,302 | -460,664 | -497,800 | -542,217 | -833,202 | -1,128,685 | -1,278,403 | -1,434,878 | -1,636,061 |
| 2020's | -1,766,744 | -1,919,943 | -1,882,203 | -2,080,136 | -2,131,896 |
| - = No Data Reported; -- = Not Applicable; NA = Not Available; W = Withheld to avoid disclosure of individual company data. |
| Release Date: 6/30/2026 |
| Next Release Date: 7/31/2026 |
Referring Pages: