|
Download Data (XLS File) |
|
|||||
|
|||||
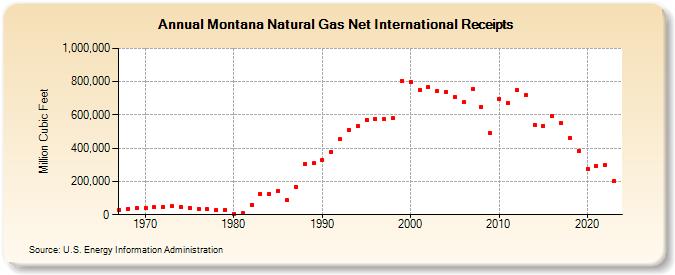
| Montana Natural Gas Net International Receipts (Million Cubic Feet) | |||||
| Decade | Year-0 | Year-1 | Year-2 | Year-3 | Year-4 | Year-5 | Year-6 | Year-7 | Year-8 | Year-9 |
|---|---|---|---|---|---|---|---|---|---|---|
| 1960's | 30,663 | 36,531 | 39,718 | |||||||
| 1970's | 42,451 | 44,534 | 48,462 | 49,976 | 48,080 | 42,114 | 35,588 | 31,588 | 28,036 | 30,005 |
| 1980's | 7,154 | 7,690 | 60,496 | 127,253 | 125,715 | 143,229 | 86,434 | 167,324 | 303,500 | 309,084 |
| 1990's | 327,628 | 377,125 | 452,467 | 511,188 | 532,768 | 570,396 | 576,420 | 572,977 | 580,548 | 805,614 |
| 2000's | 798,420 | 749,260 | 766,770 | 745,373 | 739,770 | 708,615 | 675,744 | 758,709 | 649,639 | 489,931 |
| 2010's | 696,684 | 673,022 | 749,725 | 716,822 | 540,243 | 534,772 | 593,170 | 549,872 | 464,207 | 384,091 |
| 2020's | 275,682 | 292,121 | 298,057 | 200,852 | 189,773 |
| - = No Data Reported; -- = Not Applicable; NA = Not Available; W = Withheld to avoid disclosure of individual company data. |
| Release Date: 6/30/2026 |
| Next Release Date: 7/31/2026 |