|
Download Data (XLS File) |
|
|||||
|
|||||
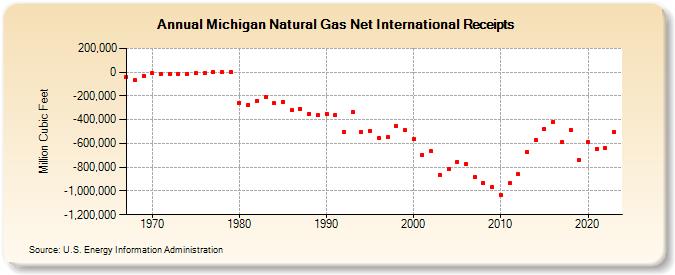
| Michigan Natural Gas Net International Receipts (Million Cubic Feet) | |||||
| Decade | Year-0 | Year-1 | Year-2 | Year-3 | Year-4 | Year-5 | Year-6 | Year-7 | Year-8 | Year-9 |
|---|---|---|---|---|---|---|---|---|---|---|
| 1960's | -40,418 | -68,044 | -29,765 | |||||||
| 1970's | -10,643 | -14,236 | -15,426 | -14,736 | -13,232 | -10,153 | -7,461 | 0 | 0 | 0 |
| 1980's | -255,916 | -272,907 | -241,607 | -211,313 | -262,221 | -249,451 | -321,194 | -306,588 | -348,057 | -363,680 |
| 1990's | -349,146 | -359,890 | -500,801 | -333,631 | -504,649 | -492,955 | -557,653 | -549,710 | -451,801 | -490,348 |
| 2000's | -564,177 | -694,850 | -666,668 | -864,897 | -818,040 | -756,268 | -769,321 | -883,248 | -931,065 | -970,021 |
| 2010's | -1,034,915 | -935,306 | -860,990 | -669,895 | -568,591 | -479,127 | -419,577 | -587,102 | -484,416 | -739,716 |
| 2020's | -586,533 | -643,427 | -637,509 | -500,285 | -455,617 |
| - = No Data Reported; -- = Not Applicable; NA = Not Available; W = Withheld to avoid disclosure of individual company data. |
| Release Date: 6/30/2026 |
| Next Release Date: 7/31/2026 |