|
Download Data (XLS File) |
|
|||||
|
|||||
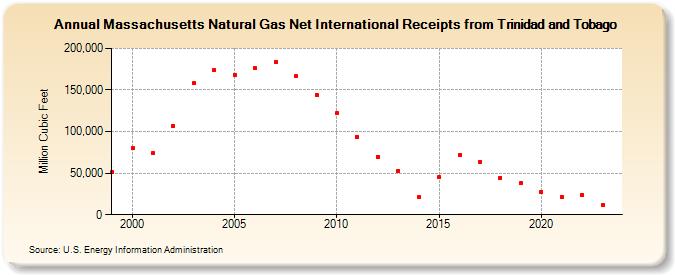
| Massachusetts Natural Gas Net International Receipts from Trinidad and Tobago (Million Cubic Feet) | |||||
| Decade | Year-0 | Year-1 | Year-2 | Year-3 | Year-4 | Year-5 | Year-6 | Year-7 | Year-8 | Year-9 |
|---|---|---|---|---|---|---|---|---|---|---|
| 1990's | 50,777 | |||||||||
| 2000's | 80,003 | 74,030 | 107,037 | 158,277 | 173,780 | 168,542 | 176,097 | 183,624 | 166,247 | 144,531 |
| 2010's | 122,252 | 93,636 | 69,993 | 52,963 | 20,819 | 44,852 | 72,266 | 63,936 | 44,749 | 37,675 |
| 2020's | 27,812 | 21,423 | 23,869 | 11,929 | 8,951 |
| - = No Data Reported; -- = Not Applicable; NA = Not Available; W = Withheld to avoid disclosure of individual company data. |
| Release Date: 6/30/2026 |
| Next Release Date: 7/31/2026 |