|
Download Data (XLS File) |
|
|||||
|
|||||
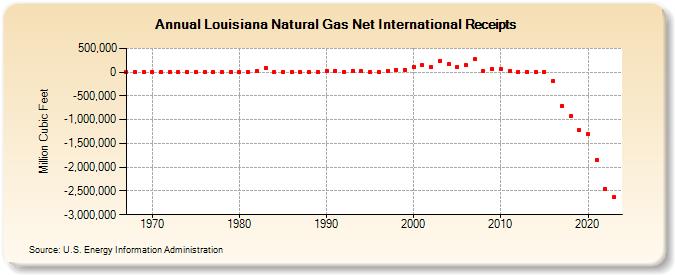
| Louisiana Natural Gas Net International Receipts (Million Cubic Feet) | |||||
| Decade | Year-0 | Year-1 | Year-2 | Year-3 | Year-4 | Year-5 | Year-6 | Year-7 | Year-8 | Year-9 |
|---|---|---|---|---|---|---|---|---|---|---|
| 1960's | 0 | 0 | 0 | |||||||
| 1970's | 0 | 0 | 0 | 0 | 0 | 0 | 0 | 0 | 0 | 0 |
| 1980's | 0 | 0 | 23,114 | 96,945 | 0 | 0 | 0 | 0 | 0 | 3,934 |
| 1990's | 30,750 | 33,284 | 12,637 | 30,790 | 17,887 | 5,149 | 7,042 | 30,596 | 42,922 | 55,302 |
| 2000's | 115,767 | 142,764 | 102,130 | 238,237 | 163,738 | 108,967 | 144,060 | 268,714 | 18,110 | 70,099 |
| 2010's | 68,053 | 22,003 | 12,477 | 5,750 | 5,880 | 8,911 | -186,364 | -706,645 | -932,202 | -1,225,536 |
| 2020's | -1,309,306 | -1,843,491 | -2,453,265 | -2,634,813 | -2,669,514 |
| - = No Data Reported; -- = Not Applicable; NA = Not Available; W = Withheld to avoid disclosure of individual company data. |
| Release Date: 6/30/2026 |
| Next Release Date: 7/31/2026 |