|
Download Data (XLS File) |
|
|||||
|
|||||
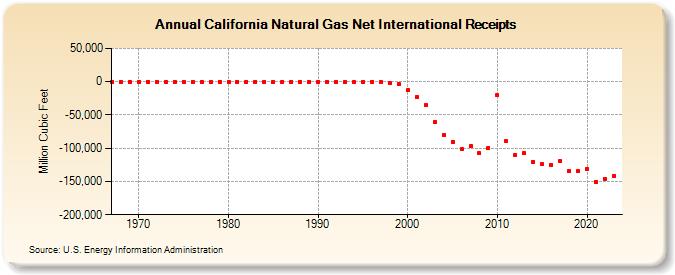
| California Natural Gas Net International Receipts (Million Cubic Feet) | |||||
| Decade | Year-0 | Year-1 | Year-2 | Year-3 | Year-4 | Year-5 | Year-6 | Year-7 | Year-8 | Year-9 |
|---|---|---|---|---|---|---|---|---|---|---|
| 1960's | 0 | 0 | 0 | |||||||
| 1970's | 0 | 0 | 0 | 0 | 0 | 0 | 0 | 0 | 0 | 0 |
| 1980's | 0 | 0 | 0 | 0 | 0 | 0 | 0 | 0 | 0 | 0 |
| 1990's | 0 | 0 | 0 | 0 | 0 | 0 | 0 | -308 | -2,067 | -3,761 |
| 2000's | -13,152 | -23,320 | -35,305 | -60,857 | -80,019 | -89,987 | -101,101 | -96,757 | -107,783 | -99,397 |
| 2010's | -20,775 | -89,878 | -109,787 | -107,249 | -120,359 | -124,276 | -125,046 | -118,929 | -134,627 | -134,532 |
| 2020's | -131,143 | -150,347 | -145,697 | -141,335 | -155,331 |
| - = No Data Reported; -- = Not Applicable; NA = Not Available; W = Withheld to avoid disclosure of individual company data. |
| Release Date: 6/30/2026 |
| Next Release Date: 7/31/2026 |