|
Download Data (XLS File) |
|
||||||||
|
||||||||
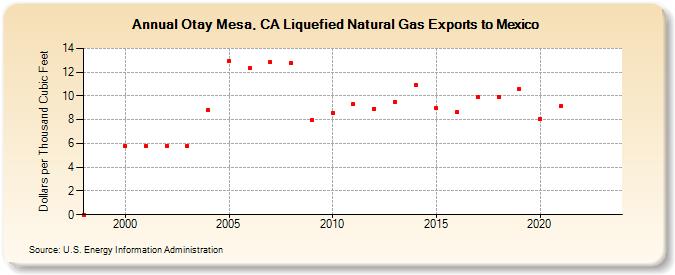
| Otay Mesa, CA Liquefied Natural Gas Exports to Mexico (Dollars per Thousand Cubic Feet) | ||||||||
| Decade | Year-0 | Year-1 | Year-2 | Year-3 | Year-4 | Year-5 | Year-6 | Year-7 | Year-8 | Year-9 |
|---|---|---|---|---|---|---|---|---|---|---|
| 1990's | NA | NA | ||||||||
| 2000's | 5.82 | 5.82 | 5.82 | 5.82 | 8.82 | 12.92 | 12.33 | 12.85 | 12.76 | 7.97 |
| 2010's | 8.58 | 9.31 | 8.92 | 9.51 | 10.95 | 8.95 | 8.63 | 9.87 | 9.93 | 10.61 |
| 2020's | 8.07 | 9.13 | -- | -- | -- |
| - = No Data Reported; -- = Not Applicable; NA = Not Available; W = Withheld to avoid disclosure of individual company data. |
| Release Date: 5/29/2026 |
| Next Release Date: 6/30/2026 |