|
Download Data (XLS File) |
|
||||||||
|
||||||||
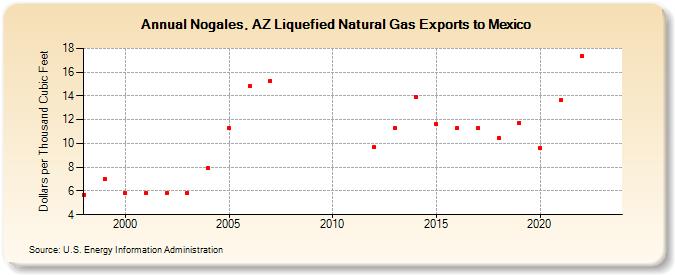
| Nogales, AZ Liquefied Natural Gas Exports to Mexico (Dollars per Thousand Cubic Feet) | ||||||||
| Decade | Year-0 | Year-1 | Year-2 | Year-3 | Year-4 | Year-5 | Year-6 | Year-7 | Year-8 | Year-9 |
|---|---|---|---|---|---|---|---|---|---|---|
| 1990's | 5.69 | 7.01 | ||||||||
| 2000's | 5.82 | 5.82 | 5.82 | 5.82 | 7.90 | 11.27 | 14.83 | 15.27 | -- | -- |
| 2010's | -- | -- | 9.68 | 11.34 | 13.95 | 11.61 | 11.31 | 11.32 | 10.45 | 11.72 |
| 2020's | 9.61 | 13.64 | 17.39 | -- | -- |
| - = No Data Reported; -- = Not Applicable; NA = Not Available; W = Withheld to avoid disclosure of individual company data. |
| Release Date: 6/30/2026 |
| Next Release Date: 7/31/2026 |