|
Download Data (XLS File) |
|
||||||||
|
||||||||
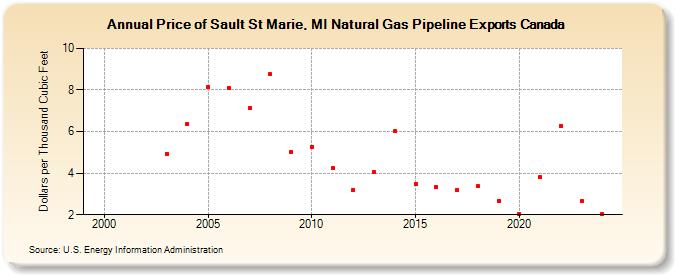
| Price of Sault St Marie, MI Natural Gas Pipeline Exports Canada (Dollars per Thousand Cubic Feet) | ||||||||
| Decade | Year-0 | Year-1 | Year-2 | Year-3 | Year-4 | Year-5 | Year-6 | Year-7 | Year-8 | Year-9 |
|---|---|---|---|---|---|---|---|---|---|---|
| 1990's | NA | |||||||||
| 2000's | NA | NA | NA | 4.94 | 6.38 | 8.13 | 8.11 | 7.13 | 8.75 | 5.04 |
| 2010's | 5.27 | 4.23 | 3.20 | 4.04 | 6.01 | 3.47 | 3.34 | 3.20 | 3.36 | 2.66 |
| 2020's | 2.04 | 3.80 | 6.28 | 2.64 | 2.02 | 3.06 |
| - = No Data Reported; -- = Not Applicable; NA = Not Available; W = Withheld to avoid disclosure of individual company data. |
| Release Date: 6/30/2026 |
| Next Release Date: 7/31/2026 |