|
Download Data (XLS File) |
|
||||||||
|
||||||||
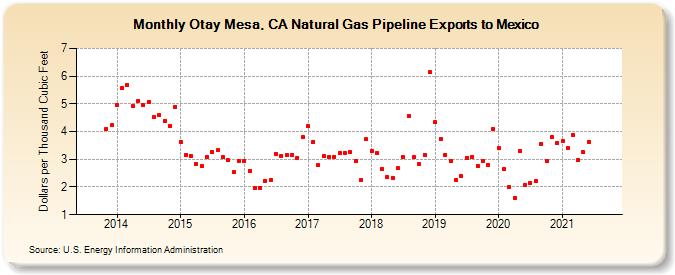
| Otay Mesa, CA Natural Gas Pipeline Exports to Mexico (Dollars per Thousand Cubic Feet) | ||||||||
| Year | Jan | Feb | Mar | Apr | May | Jun | Jul | Aug | Sep | Oct | Nov | Dec |
|---|---|---|---|---|---|---|---|---|---|---|---|---|
| 2013 | 4.10 | 4.22 | ||||||||||
| 2014 | 4.95 | 5.58 | 5.68 | 4.91 | 5.11 | 4.95 | 5.07 | 4.51 | 4.60 | 4.38 | 4.21 | 4.90 |
| 2015 | 3.63 | 3.15 | 3.12 | 2.84 | 2.76 | 3.09 | 3.28 | 3.32 | 3.07 | 2.98 | 2.54 | 2.94 |
| 2016 | 2.94 | 2.59 | 1.97 | 1.98 | 2.22 | 2.26 | 3.20 | 3.12 | 3.17 | 3.17 | 3.06 | 3.79 |
| 2017 | 4.19 | 3.64 | 2.78 | 3.11 | 3.10 | 3.10 | 3.22 | 3.24 | 3.25 | 2.94 | 2.24 | 3.72 |
| 2018 | 3.29 | 3.23 | 2.66 | 2.35 | 2.34 | 2.68 | 3.08 | 4.56 | 3.08 | 2.82 | 3.17 | 6.14 |
| 2019 | 4.33 | 3.74 | 3.17 | 2.95 | 2.25 | 2.38 | 3.06 | 3.09 | 2.77 | 2.93 | 2.81 | 4.08 |
| 2020 | 3.39 | 2.65 | 2.01 | 1.62 | 3.29 | 2.08 | 2.15 | 2.20 | 3.56 | 2.94 | 3.80 | 3.57 |
| 2021 | 3.65 | 3.39 | 3.89 | 2.97 | 3.25 | 3.62 | ||||||
| - = No Data Reported; -- = Not Applicable; NA = Not Available; W = Withheld to avoid disclosure of individual company data. |
| Release Date: 6/30/2026 |
| Next Release Date: 7/31/2026 |