|
Download Data (XLS File) |
|
||||||||
|
||||||||
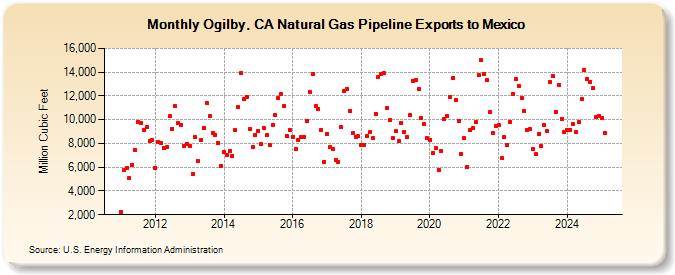
| Ogilby, CA Natural Gas Pipeline Exports to Mexico (Million Cubic Feet) | ||||||||
| Year | Jan | Feb | Mar | Apr | May | Jun | Jul | Aug | Sep | Oct | Nov | Dec |
|---|---|---|---|---|---|---|---|---|---|---|---|---|
| 2011 | 2,249 | 5,761 | 5,912 | 5,065 | 6,188 | 7,456 | 9,816 | 9,758 | 9,137 | 9,369 | 8,233 | 8,315 |
| 2012 | 5,922 | 8,096 | 8,035 | 7,614 | 7,659 | 10,286 | 9,253 | 11,135 | 9,715 | 9,554 | 7,815 | 7,967 |
| 2013 | 7,784 | 5,458 | 8,504 | 6,550 | 8,323 | 9,317 | 11,374 | 10,279 | 8,884 | 8,751 | 8,072 | 6,133 |
| 2014 | 7,269 | 7,066 | 7,374 | 6,975 | 9,105 | 11,046 | 13,938 | 11,726 | 11,940 | 9,218 | 7,703 | 8,718 |
| 2015 | 9,056 | 7,944 | 9,265 | 8,717 | 7,829 | 9,538 | 10,353 | 11,806 | 12,155 | 11,135 | 8,654 | 9,164 |
| 2016 | 8,563 | 7,543 | 8,325 | 8,535 | 8,555 | 9,850 | 12,361 | 13,854 | 11,125 | 10,904 | 9,144 | 6,467 |
| 2017 | 8,834 | 7,668 | 7,551 | 6,564 | 6,478 | 9,346 | 12,410 | 12,602 | 10,747 | 8,846 | 8,575 | 8,596 |
| 2018 | 7,875 | 7,843 | 8,591 | 8,923 | 8,424 | 10,508 | 13,556 | 13,835 | 13,913 | 10,941 | 9,936 | 8,490 |
| 2019 | 9,030 | 8,179 | 9,698 | 8,989 | 8,568 | 10,369 | 13,272 | 13,324 | 12,620 | 10,108 | 9,614 | 8,431 |
| 2020 | 8,302 | 7,189 | 7,644 | 5,794 | 7,330 | 10,096 | 10,333 | 11,949 | 13,491 | 11,652 | 9,906 | 7,104 |
| 2021 | 8,436 | 5,978 | 9,094 | 9,259 | 9,780 | 13,751 | 14,999 | 13,847 | 13,368 | 10,663 | 8,857 | 9,436 |
| 2022 | 9,510 | 6,783 | 8,553 | 7,901 | 9,841 | 12,180 | 13,386 | 12,859 | 11,866 | 10,725 | 9,110 | 9,193 |
| 2023 | 7,531 | 7,092 | 8,775 | 7,765 | 9,526 | 9,025 | 13,152 | 13,684 | 10,668 | 12,928 | 10,091 | 8,949 |
| 2024 | 9,169 | 9,155 | 9,625 | 8,983 | 9,835 | 11,736 | 14,146 | 13,414 | 13,175 | 12,661 | 10,205 | 10,335 |
| 2025 | 10,171 | 8,874 | 8,248 | 9,381 | 11,634 | 12,241 | 15,541 | 15,388 | 14,611 | 12,530 | 11,332 | 10,938 |
| 2026 | 7,566 | 9,950 | 10,394 | 9,632 | ||||||||
| - = No Data Reported; -- = Not Applicable; NA = Not Available; W = Withheld to avoid disclosure of individual company data. |
| Release Date: 6/30/2026 |
| Next Release Date: 7/31/2026 |