|
Download Data (XLS File) |
|
||||||||
|
||||||||
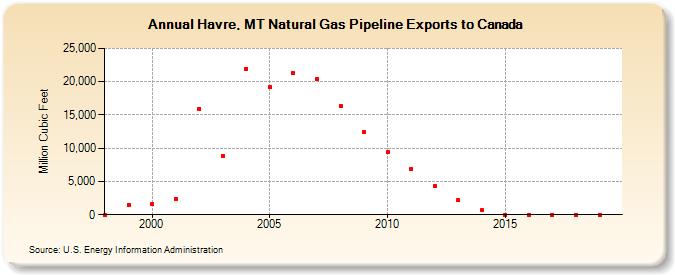
| Havre, MT Natural Gas Pipeline Exports to Canada (Million Cubic Feet) | ||||||||
| Decade | Year-0 | Year-1 | Year-2 | Year-3 | Year-4 | Year-5 | Year-6 | Year-7 | Year-8 | Year-9 |
|---|---|---|---|---|---|---|---|---|---|---|
| 1990's | NA | 1,510 | ||||||||
| 2000's | 1,606 | 2,428 | 15,892 | 8,851 | 21,950 | 19,159 | 21,245 | 20,420 | 16,399 | 12,504 |
| 2010's | 9,437 | 6,806 | 4,331 | 2,160 | 680 | 3 | 0 | 0 | 0 | 0 |
| - = No Data Reported; -- = Not Applicable; NA = Not Available; W = Withheld to avoid disclosure of individual company data. |
| Release Date: 6/30/2026 |
| Next Release Date: 7/31/2026 |