|
Download Data (XLS File) |
|
||||||||
|
||||||||
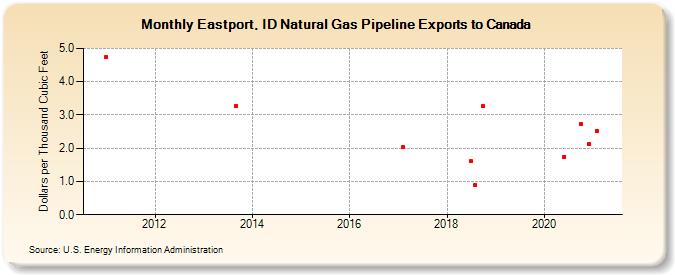
| Eastport, ID Natural Gas Pipeline Exports to Canada (Dollars per Thousand Cubic Feet) | ||||||||
| Year | Jan | Feb | Mar | Apr | May | Jun | Jul | Aug | Sep | Oct | Nov | Dec |
|---|---|---|---|---|---|---|---|---|---|---|---|---|
| 2011 | 4.74 | |||||||||||
| 2013 | 3.27 | |||||||||||
| 2017 | 2.03 | |||||||||||
| 2018 | 1.60 | 0.89 | 3.26 | |||||||||
| 2020 | 1.75 | 2.72 | 2.12 | |||||||||
| 2021 | 2.53 |
| - = No Data Reported; -- = Not Applicable; NA = Not Available; W = Withheld to avoid disclosure of individual company data. |
| Release Date: 6/30/2026 |
| Next Release Date: 7/31/2026 |